In this article
- A monitoring probe on my primary-school lawn
- What was Chernobyl Unit 4?
- Graphite, water and fuel do different jobs
- What a positive void coefficient means
- The control room: many instruments, an incomplete picture
- SKALA: why this belongs in a computer museum
- DREG and PRIZMA: recording is not calculation
- The 01:22:30 snapshot and operating reactivity margin
- The night of 25–26 April 1986
- AZ-5 and the control-rod design problem
- The final seconds and the limits of measurement
- What later investigations changed
- The consequences remain a human history
- How the museum reconstruction works
- Documented, reconstructed or schematic?
- Explore the control room
- Sources and technical notes
Chernobyl cannot be explained by one wrong button press. Understanding Unit 4 requires looking at reactor physics, protection systems, instruments, process computing and the organization behind the plant together. My new museum exhibit walks through those layers while keeping recorded events, later reconstruction and schematic illustration visibly distinct.
A monitoring probe on my primary-school lawn
When the Chernobyl reactor exploded on 26 April 1986, I was still a toddler. I do not remember the disaster itself. But something from my primary-school years has stayed with me: there was a monitoring probe on the lawn. At least, our caretaker told us that it measured radioactivity. I can no longer say for certain whether that was the device’s actual purpose. But the memory has remained.
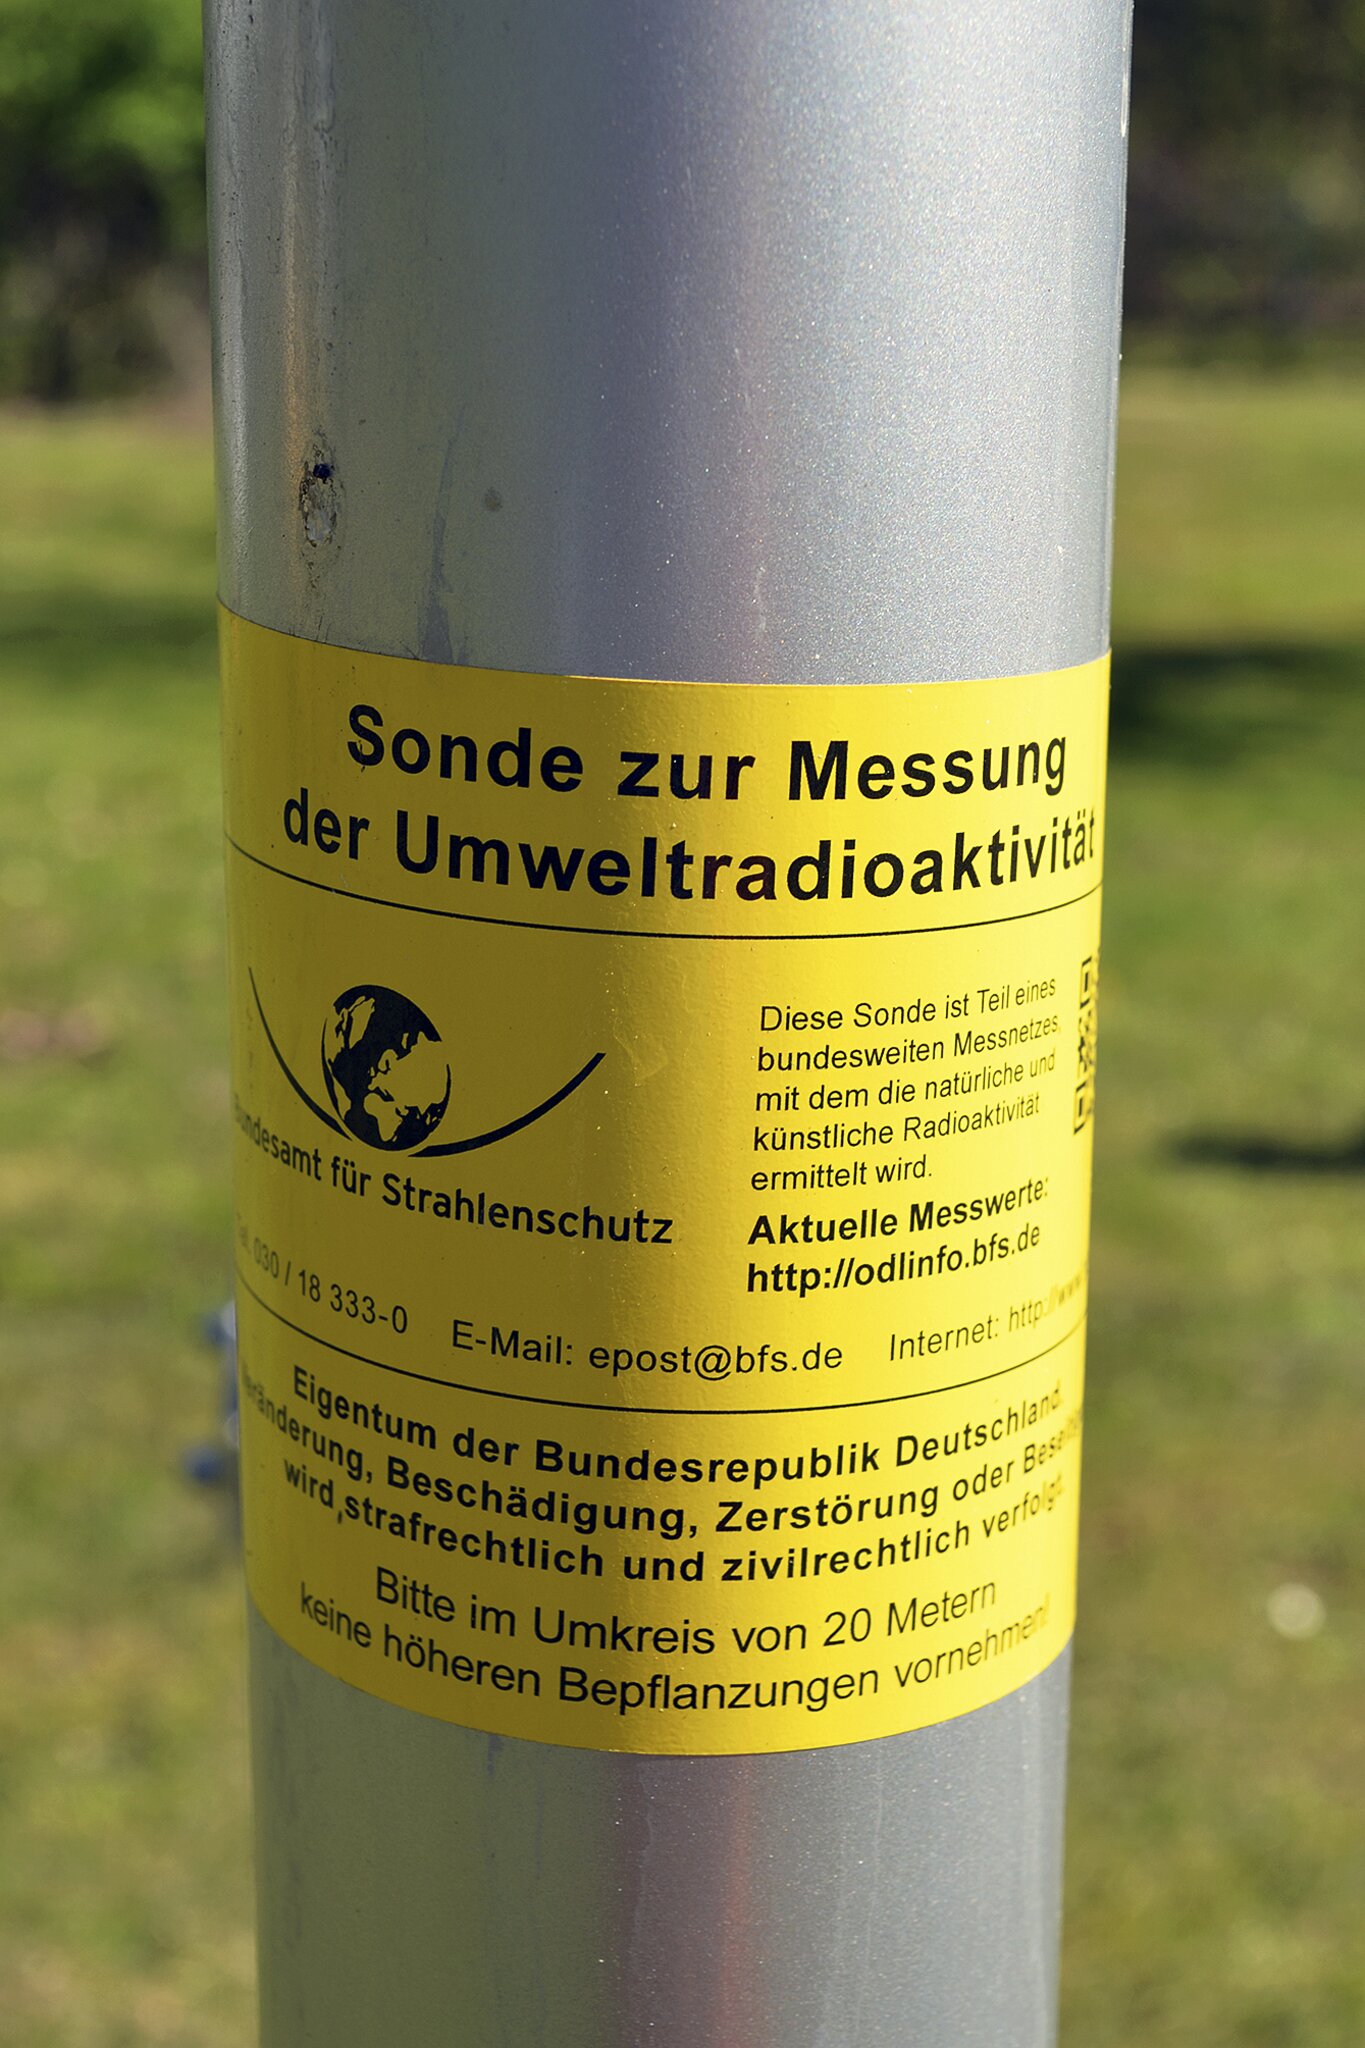
I did not simply walk past it. Even then, I wanted to know: What is that? Why is it here? What does it measure? So I asked the caretaker what it did. I remember a metal tube with a cylindrical head, and yellow lettering on its side. A comparison photograph of a probe from a neighbouring town reminds me of precisely that unobtrusive shape.
This is my personal recollection of primary school in Fintel, rather than a historical site record. Recognizing a shape today does not identify a particular model or establish who operated that installation. But the question that interested me as a child has stayed the same: how does this thing actually work? Today it leads me from SGI workstations and processor architectures to reactor instrumentation.
The wider historical connection is documented. After Chernobyl, Germany expanded environmental radioactivity monitoring into the Integrated Measuring and Information System, IMIS. Fixed probes in the ODL network measure ambient gamma dose rate. That is a radiation quantity at a location; it does not directly identify every radionuclide or establish whether a food sample is contaminated. Environmental monitoring therefore also requires other instruments and laboratory samples. This context makes the caretaker’s explanation plausible, while not independently proving the historical identity of the school device. [4] [5]
What was Chernobyl Unit 4?
Unit 4 was an RBMK-1000 in the Ukrainian SSR, then part of the Soviet Union. The design combined a graphite moderator with water-cooled pressure channels. The “1000” refers to its electrical power class. For the physics in the core, thermal power is a different quantity: heat production and electrical output must not be confused. The NEA describes approximately 3,200 MW thermal and 1,000 MW electrical for this type. When a historical account mentions 200 MW, the first question is which quantity it means. [2]
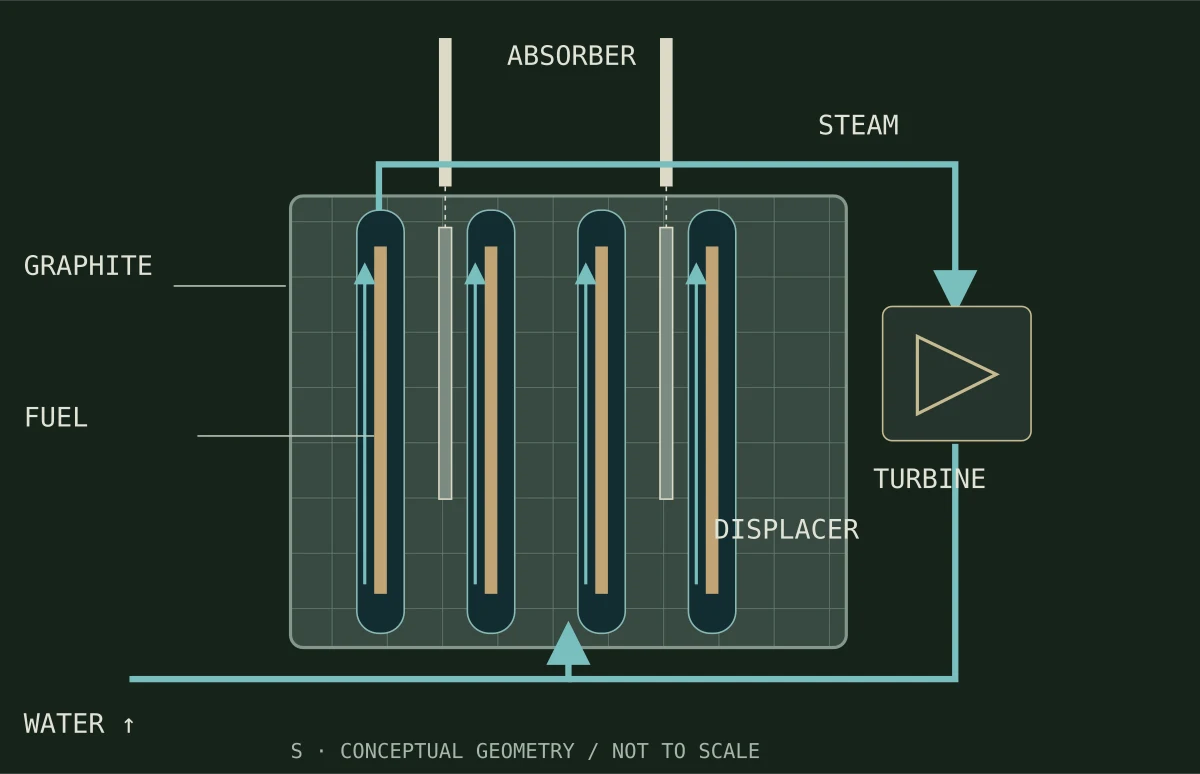
Fuel was arranged in numerous individual channels. Water passed through those channels, carried heat away and partly boiled. Steam was supplied to the turbines. Graphite surrounded the channels. Separating fuel, cooling and moderation in this way differs from designs in which water also provides most of the moderation.
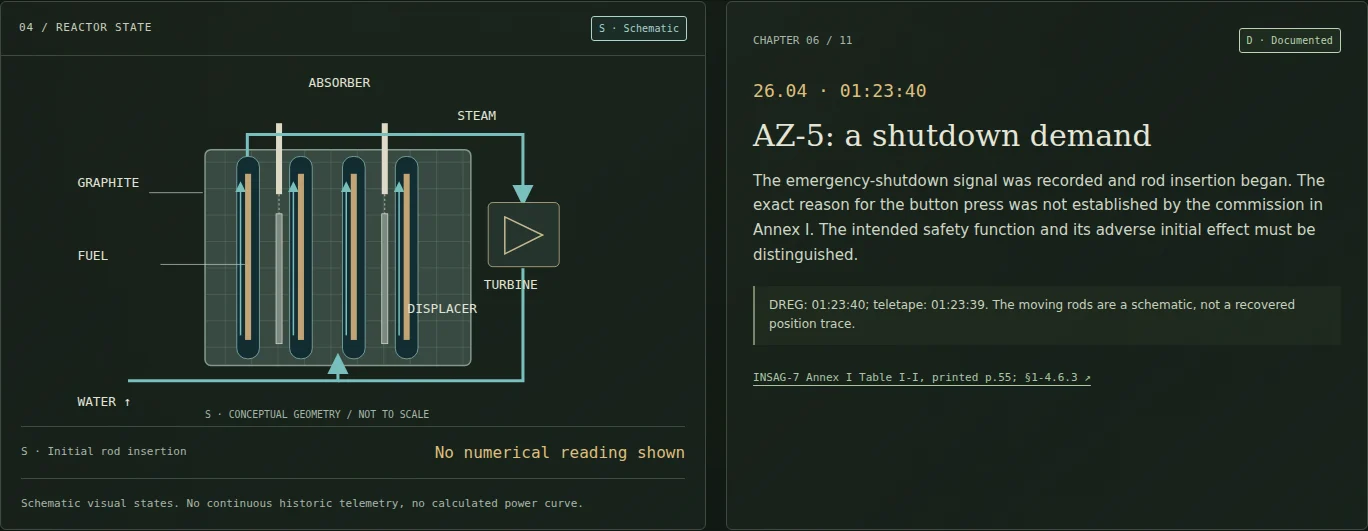
A simplified section can explain these functions without pretending to know the actual condition of every channel. My drawing contains a few representative channels. It is neither to scale nor a loading plan. In particular, its colours are not a historical neutron-flux map.
Graphite, water and fuel do different jobs
Fission in the fuel produces heat and further neutrons. Some of those neutrons cause additional fissions. A moderator slows neutrons and influences their ability to sustain that process. A coolant carries heat away. An absorber takes up neutrons and can reduce the chain reaction.
These are functions rather than a simple division into helpful and harmful materials. Water cools the fuel but also absorbs neutrons. Graphite supplies moderation and remains present when liquid water becomes steam. A material can therefore have several effects depending on its arrangement and the reactor state. That coupling is why apparently simple explanations can become misleading.
Spatial distribution matters as well. A large reactor core is not one perfectly mixed container. A total power figure does not reveal how power is distributed across its height and width. The exhibit uses terms such as “local” and “lower core” while avoiding an invented, apparently measured distribution.
What a positive void coefficient means
“Positive” describes a mathematical sign. In the relevant accident configuration, increasing steam content could add reactivity: less dense water absorbed fewer neutrons while graphite continued to moderate. Added reactivity could increase power, and increased heat could promote further steam formation. This is an amplifying feedback relationship.
Other feedbacks also exist, including the response to fuel temperature. The net response depends on the configuration, operating state and spatial distribution. “Steam always causes an explosion” would be as misleading as saying that water only cools. The exhibit explains a relationship rather than a universal one-button rule for every RBMK state. [1, §2.2]
The diagram makes those relationships visible through materials and labels. It deliberately has no adjustable pump delivery, rod positions or power demand. Its purpose is to support an explanation, not to calculate a stability boundary.
The control room: many instruments, an incomplete picture
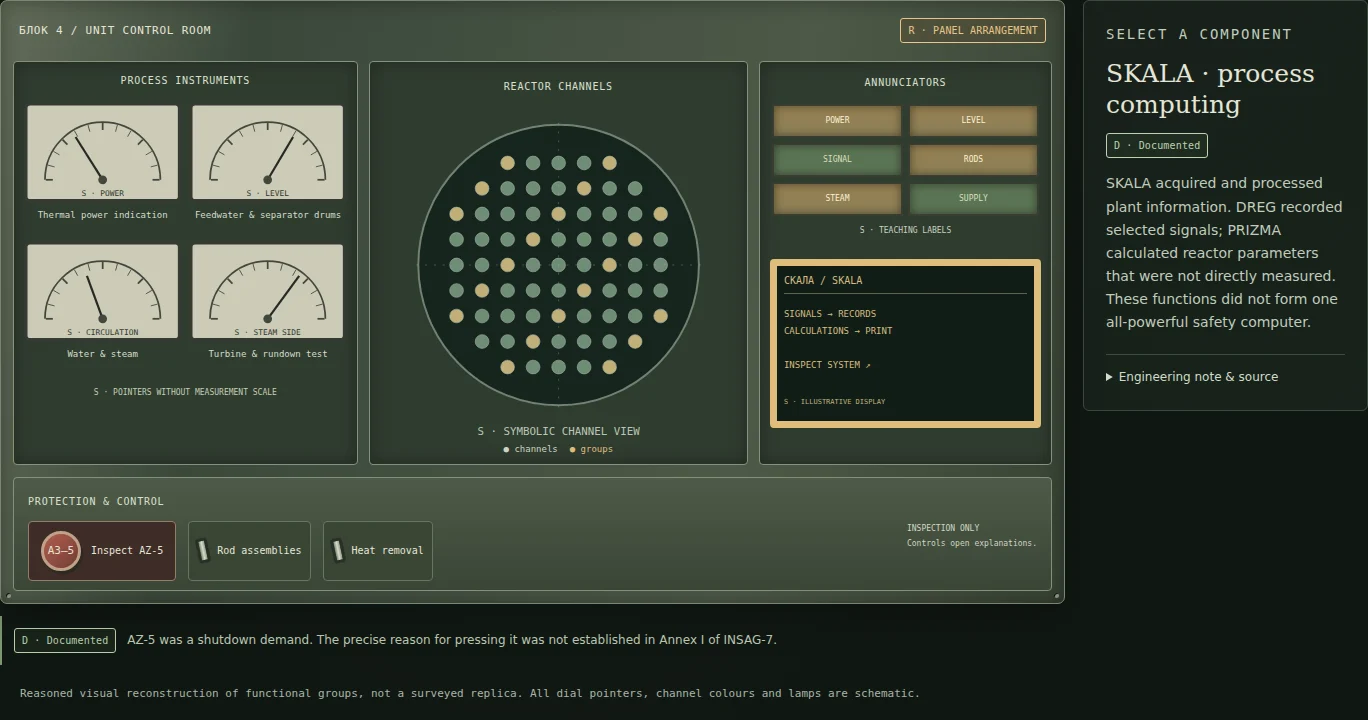
A control room brings together information from different parts of a plant: reactor power, water levels, pressures, circulation, the steam side, electrical supply and signals from regulation and protection systems. Its job is not merely to display numbers. People need to understand which information is current, trustworthy and relevant to safety.
A pointer represents a measurement channel with a scale. An annunciator represents a defined condition or threshold. A calculated quantity instead has inputs and processing time. In a modern screen reconstruction all three can look equally current. That is precisely the confusion I wanted to avoid.
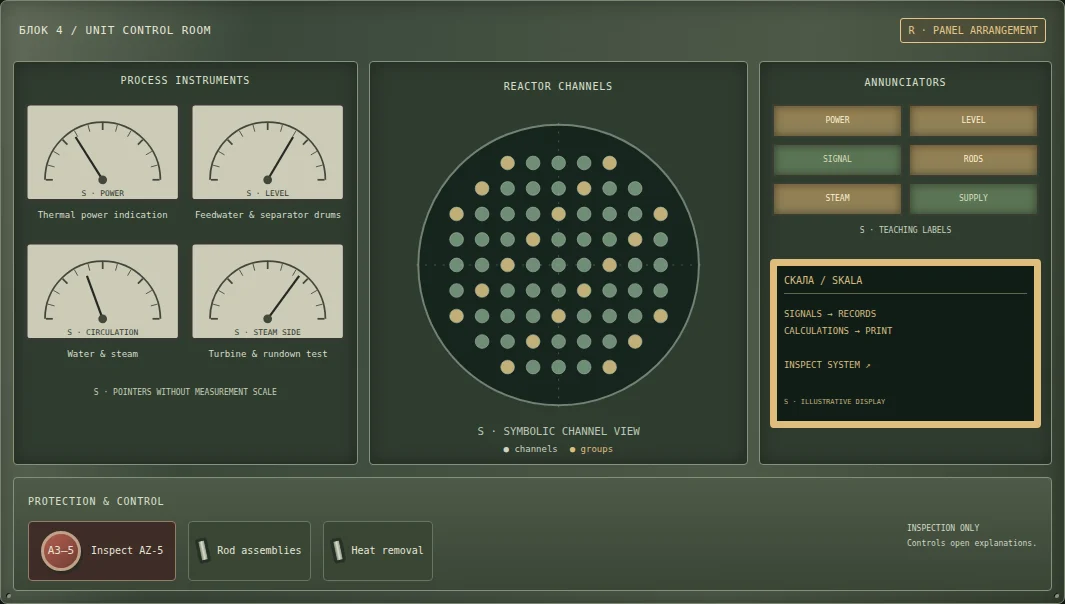
My control room is an original visual reconstruction of functional groups. Muted green panels, analogue instruments, annunciators and a sloping desk suggest an industrial environment. They do not claim to reproduce the real room’s exact dimensions and panel positions. The dial pointers have no invented numeric values, and their positions are explicitly schematic. Selecting an instrument explains its purpose and the limits of the information it represents.
SKALA: why this belongs in a computer museum
Chernobyl is also part of the history of process computing. SKALA acquired and processed plant information, supporting recording and calculation. It was not merged with every sensor, regulator and protection function into one autonomous central intelligence.
That distinction is particularly interesting in a computer museum. A process computer has to perform its work with limited processing capacity, priorities and different data cycles. A stored state can be valuable to later investigators without having provided an immediately available result to the operating crew. A program can process its available inputs and still be too slow, or too poorly integrated into the human workflow, to make a safety-relevant situation clear.
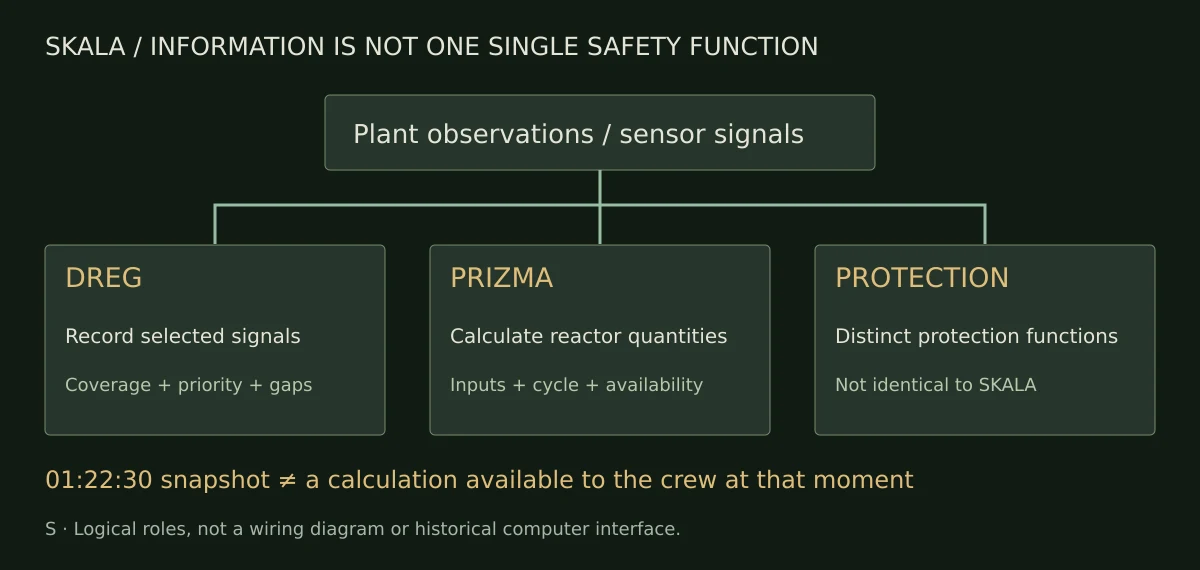
The SKALA station uses a modern teaching interface designed for this exhibit. It does not emulate the original machine, software or terminal. Instead, it separates four functions that visitors can inspect: plant signals, DREG recording, PRIZMA calculation and the distinct role of protection systems.
DREG and PRIZMA: recording is not calculation
DREG recorded diagnostic parameters. PRIZMA calculated reactor quantities that were not directly measured. Annex I of INSAG-7 describes different acquisition and calculation cycles, together with gaps associated with SKALA restarts. Some directly measured signals could be acquired quickly, but that does not make the surviving data a complete high-speed record of every reactor variable. [1, Annex I §1-4.3.2]
The final seconds therefore cannot be replayed as fully recorded telemetry. Investigators had to compare different records and use physical models. A modern animation can explain this work, but should not substitute invented precision for missing measurements.
Each computing function in the exhibit opens an introductory explanation and a deeper note. Those notes distinguish priority, freshness and availability. This is a broader lesson about information systems: data existing somewhere is not the same as the right person receiving the right interpretation in time.
The 01:22:30 snapshot and operating reactivity margin
A particularly important example is the operating reactivity margin, ORM. It was expressed in equivalent rods. That did not mean simply counting completely inserted rods: rod effectiveness and the spatial distribution affected the quantity.
Annex I describes a magnetic-tape state recording at 01:22:30. Calculations for this state were performed after the accident at Smolensk using PRIZMA-ANALOG. Those results were not available as operating calculations to the control-room or SKALA personnel at the recorded moment. [1, Annex I §1-4.5, printed pp.64–65]
Consequently, my reconstruction does not place a retrospective ORM calculation onto a seemingly historical operator instrument. A timestamp can be documented while a quantity associated with that state is reconstructed later. Preserving that distinction matters more than making a dashboard look completely populated.
The night of 25–26 April 1986
The turbine rundown test concerned an electrical-supply interval. Could a coasting turbine-generator temporarily provide power until emergency diesel supply became available? That began as a question about the electrical side, but the electrical, thermohydraulic and nuclear states of the plant were coupled.
A delay associated with grid demand prolonged operation at reduced power. Later, an unintended drop occurred during a change in power control. The report chronology gives approximately 30 MW thermal around 00:28, followed by stabilization near 200 MW thermal around 01:03. Xenon absorption and rod configuration were part of this context; low power by itself is not a complete accident explanation. [1, Annex I, Table I-I]
Xenon acts as a neutron absorber whose significance depends on previous operation. It is not an impurity that an operator can simply remove from a dashboard. The exhibit introduces the relationship without inventing a xenon history or offering a reactor operating sequence to reproduce it.
The test start is anchored at 01:23:04. DREG gives the shutdown signal at 01:23:40, while another record gives 01:23:39. Protection and failure indications follow rapidly in the report chronology. These timestamps support the sequence, but do not automatically fill every interval between recorded events.
AZ-5 and the control-rod design problem
AZ-5 requested an emergency shutdown. Its intended function was to insert protection and control rods and suppress the chain reaction. That intention makes the accident particularly serious from a safety-engineering perspective: under the relevant conditions, an intended protective action could initially have an adverse local effect.
The original assemblies included graphite displacers as well as neutron-absorbing material. During insertion from a substantially withdrawn position, water could be displaced near the bottom of the core before the desired absorption effect reached that region. The response was spatially distributed. A cartoon with one “graphite tip” and one temperature reading cannot explain the geometry adequately. [1, §2.2 and Annex I §1-3.8]
A separate limit concerns motivation. The commission in Annex I could not establish why the button was pressed. My sequence therefore presents neither a proven panicked rescue attempt nor an unequivocally established routine shutdown. It identifies the demand, its recorded time and the design issue without inventing the participants’ thoughts.
The final seconds and the limits of measurement
Post-accident analyses connect initial rod effects, spatial power distribution and reinforcing feedbacks to the rapid escalation. The chronology lists relevant protection signals from 01:23:43, followed by pressure and measurement-system failure indications. Reliable instruments did not capture the complete final excursion.
The reactor was destroyed. Explosions, fires and radioactive release made the event a catastrophe far beyond the plant. The exact mechanics of individual final destructive events retain uncertainties. I therefore show neither a precisely numbered peak power nor a supposedly calculated explosion sequence.
Instead, the diagram becomes muted and ceases to represent a valid operating state. This is a design convention for lost observability. It does not claim that a real historical screen faded in this particular way.
What later investigations changed
INSAG-7 was published in 1992 to update the 1986 assessment. It places design, inadequately communicated hazards, operating rules, decisions and safety culture in a broader picture. A narrative reduced entirely to operator misconduct does not adequately explain the accident. Removing operating and organizational factors altogether would be equally incomplete. [1, §§4–5]
Sources themselves need context. The NEA overview is useful for the plant and consequences, but retains some older simplifications in its account of the sequence. For AZ-5, ORM and pre-shutdown behaviour, this exhibit follows the more differentiated discussion in INSAG-7. Its main text and annexes are not a single perfectly consistent second-by-second dataset either.
Later measures addressed rod design, shutdown behaviour, reactivity characteristics and operating restrictions. This exhibit concerns Unit 4 in 1986; it does not treat that configuration as identical to every subsequent RBMK version.
The consequences remain a human history
Plant workers and emergency responders suffered fatal injuries and severe radiation damage. People had to leave their homes, communities were disrupted and large areas were contaminated. The technical events of one night are therefore only part of the history.
UNSCEAR distinguishes acute radiation illness, subsequent epidemiological findings and the consequences of evacuation and relocation. Its assessments of thyroid cancer among people exposed when young each concern particular populations and periods. A single sweeping casualty figure would combine different categories and uncertainties. I link the relevant assessments rather than presenting a seemingly final counter. [3]
How the museum reconstruction works
The exhibit has five stations. Reactor basics separates the jobs of graphite, water, fuel and rods. The control room offers selectable instruments and functional groups. SKALA explains data paths, recording, calculation and protection. The historical sequence contains eleven captioned chapters. Technical findings connects the main lessons and the limits of reconstruction.
Only one station dominates the page at a time. In the control room visitors can toggle labels, a system relationship overlay, a core section and historical annotations. The evidence legend remains visible. A button opens an explanation instead of silently changing a plant state. In free exploration AZ-5 is an information point too.
“Start Historical Accident Sequence” begins automatic progression. Pause, previous, next and restart allow visitors to read at their own pace. The interval is reading time rather than physical time. Manual navigation, switching stations and hiding the page all pause playback. The sequence stops at the final chapter without automatically looping.
Documented, reconstructed or schematic?
D — documented: the cited source supports a statement or timestamp. This may be a report finding rather than a direct sensor measurement. R — reconstructed: a state was inferred later, or a visual arrangement has been interpreted. S — schematic: the graphic explains a relationship without claiming a historical reading or calculated physics.
These categories apply to individual claims and visuals. One chapter can contain a documented timestamp, describe a later reconstruction and show a schematic drawing alongside both. One blanket “historically accurate” label would hide those differences.
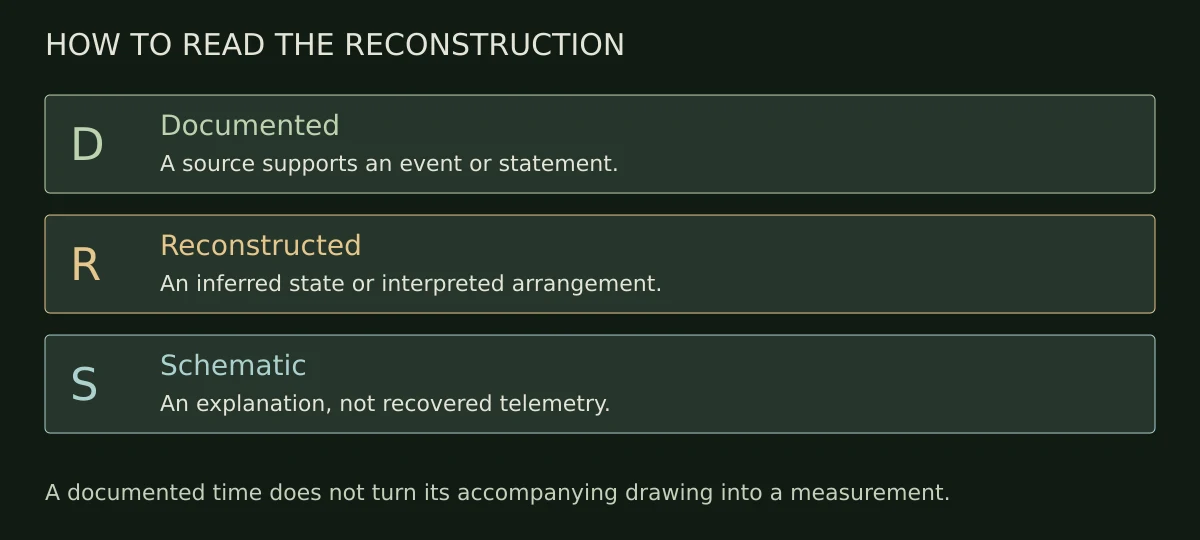
The browser executes a curated sequence of presentation states. It does not emulate SKALA, solve neutron transport or calculate thermohydraulics. Original diagrams are not historical photographs. The interface images are actual captures of this museum exhibit, not contemporary pictures from the power plant.
Explore the control room
Begin with the materials in the core section, inspect the instruments and then look at SKALA. The historical sequence becomes easier to interpret once the differences between measurement, calculation and retrospective knowledge are clear. Source references at each station provide a route into the underlying reports.
Open Chernobyl Unit 4 — RBMK Control Room & SKALA →
Sources and technical notes
- IAEA: The Chernobyl Accident: Updating of INSAG-1, INSAG-7 (1992). Basis for the accident analysis and qualified chronology. Particularly §§2–5; Annex I §§1-3.8, 1-4.3–1-4.6 and Table I-I; Annex II for modelling. Page references use printed pagination, not PDF viewer numbers.
- OECD/NEA: Chernobyl — Assessment of Radiological and Health Impacts, 2002, chapter I. Plant and reactor context. Older simplifications do not override the differentiated INSAG-7 discussion.
- UNSCEAR: Assessments of radiation effects from the Chornobyl accident. Access to reports on exposure and health consequences; distinguish their respective reporting periods.
- German Federal Environment Ministry: environmental radioactivity monitoring and Berlin Senate: IMIS. Official context for developments after 1986.
- Federal Office for Radiation Protection: ODL-Info. Measurement principle and network, rather than proof of the historical school location. The comparison photograph I supplied from a neighbouring town is a visual reference for the shape only. It is not republished here as my image or a historical school photograph.
Sources checked on 16 October 2026. Personal recollection: Dennis Hilk. Design, diagrams and interface captures: original museum reconstruction. No connection to a plant, operational reactor simulation or plant operating instructions.